Risk criteria plots
The risk criteria guide our recommendations about what to do with a given risk or collection of risks. We define what risk is acceptable to the organization. We can plot risks and risk criteria to see the results of our analysis.
The risk criteria guide our recommendations about what to do with a given risk or collection of risks. We define what risk is acceptable to the organization. We can plot risks and risk criteria to see the results of our analysis.
It might be tempting for someone in the organization to suggest that we have “zero tolerance” for risk. This bit of hyperbole is rarely helpful. Every organization operates with risk and uncertainty. The real question for legal risk management is how much to invest to reduce the risk to an acceptable level.
Likelihood and consequences define the risk plot
When establishing the risk criteria consider which consequences matter or are “within scope.”
In addition to leveraging the definition of likelihood from the risk framework, we want to identify the timeframe that matter. The fact that some risk might materialize at some distance point may not warrant our attention. However, the likelihood of a risk event in the next two year is sufficiently near term. The important point is to have a clear sense of the timeframe within which we will consider risks.
Our risk criteria should include the overall risk rating as well as the independent variables likelihood and consequences. It is not unusual, for example, to tolerate high likelihood/low consequence risks more than low likelihood/high consequence risks, even though they are mathematically the same.
Plotting risks and risk criteria
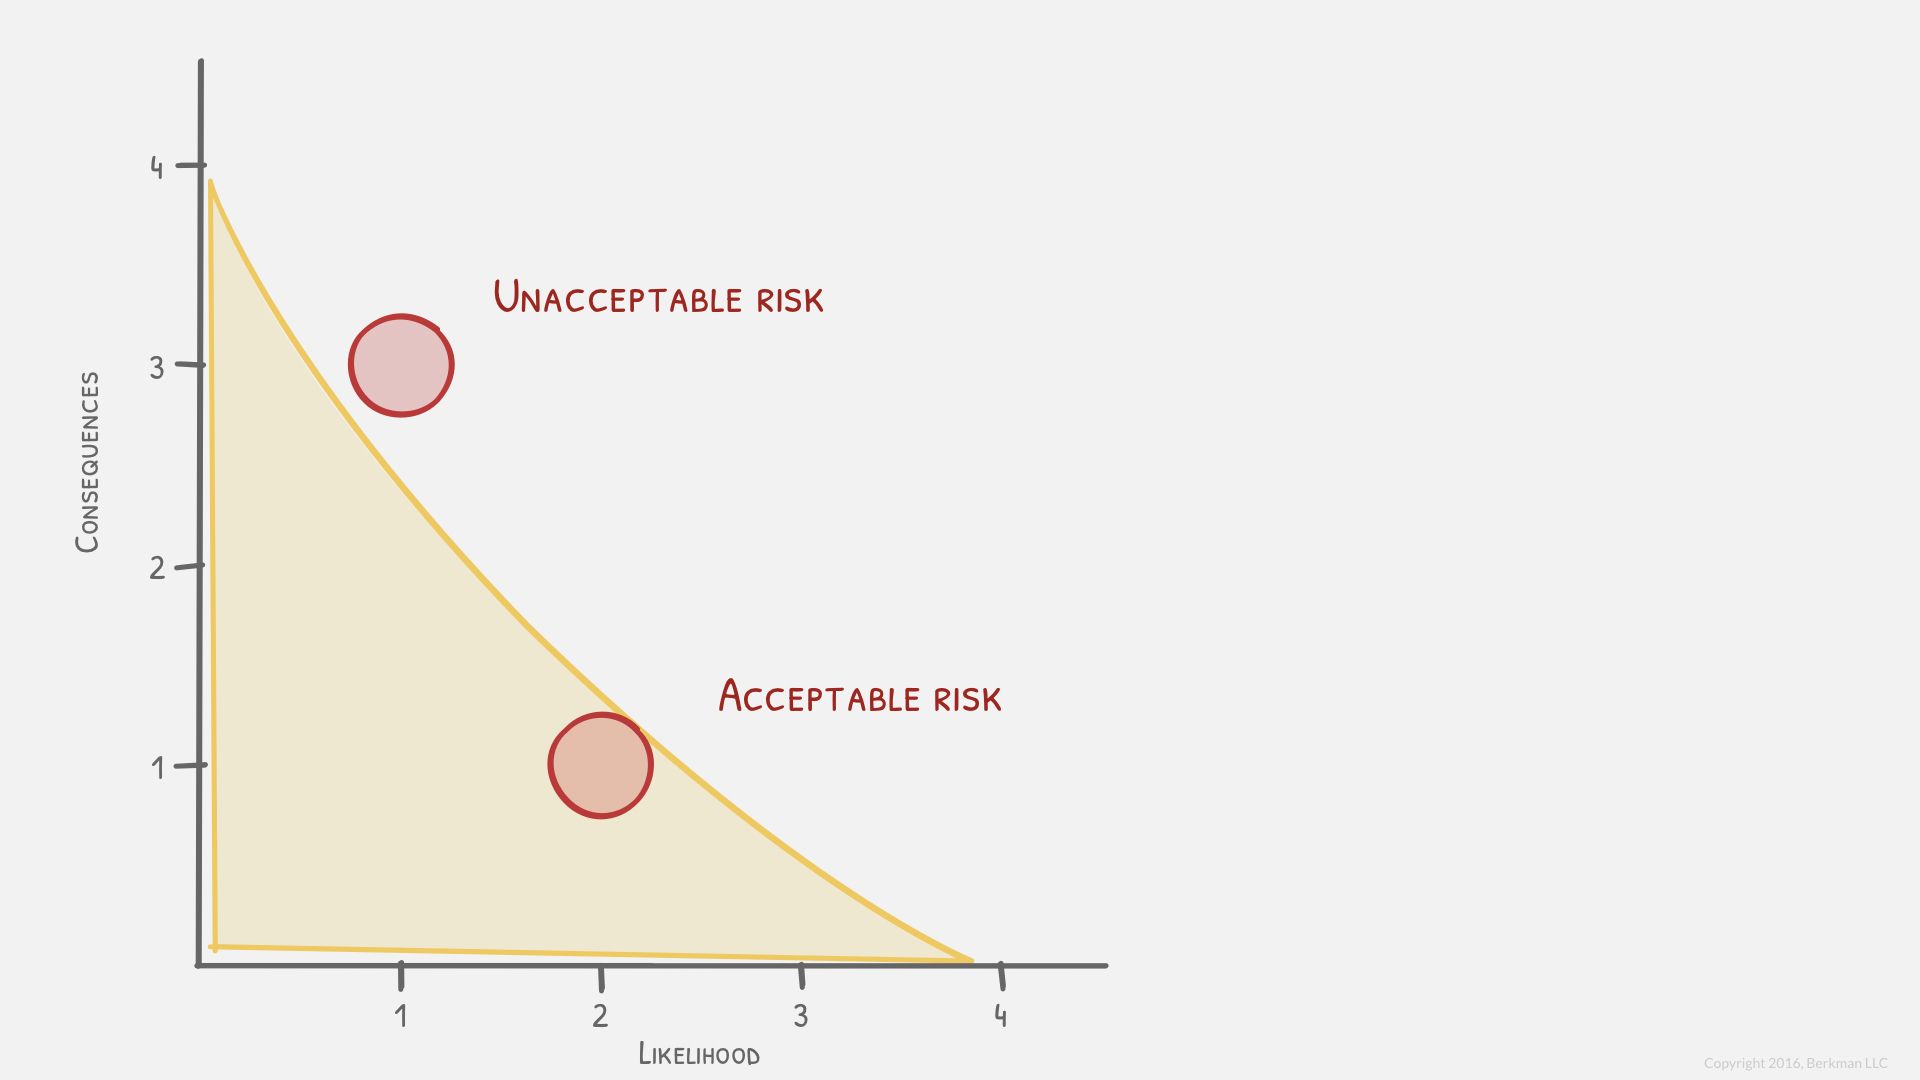
Here is a plot of our two previous legal risks. The risk in the upper left is rated as having significant consequences so we gave it a 3. The likelihood, however, is unlikely or a 1.
The second risk in the lower right has insignificant consequences (rated as a 1) and somewhat likely (a 2 on the likelihood scale).
The yellow area indicates our risk criteria or our risk tolerance. Risks within the yellow area are tolerable, otherwise they are unacceptable.
Why isn’t the diagonal line straight? Why aren’t the points placed precisely on each scale?
We don’t want to convey a false sense of precision, unless we know with certainty how to draw the diagonal and were to pin the height and width of the risk tolerance area. The objective of this exercise is to see how different organizations approach risk tolerance and how those differences shape their investments in risk management.
Plotting risks with risk treatment
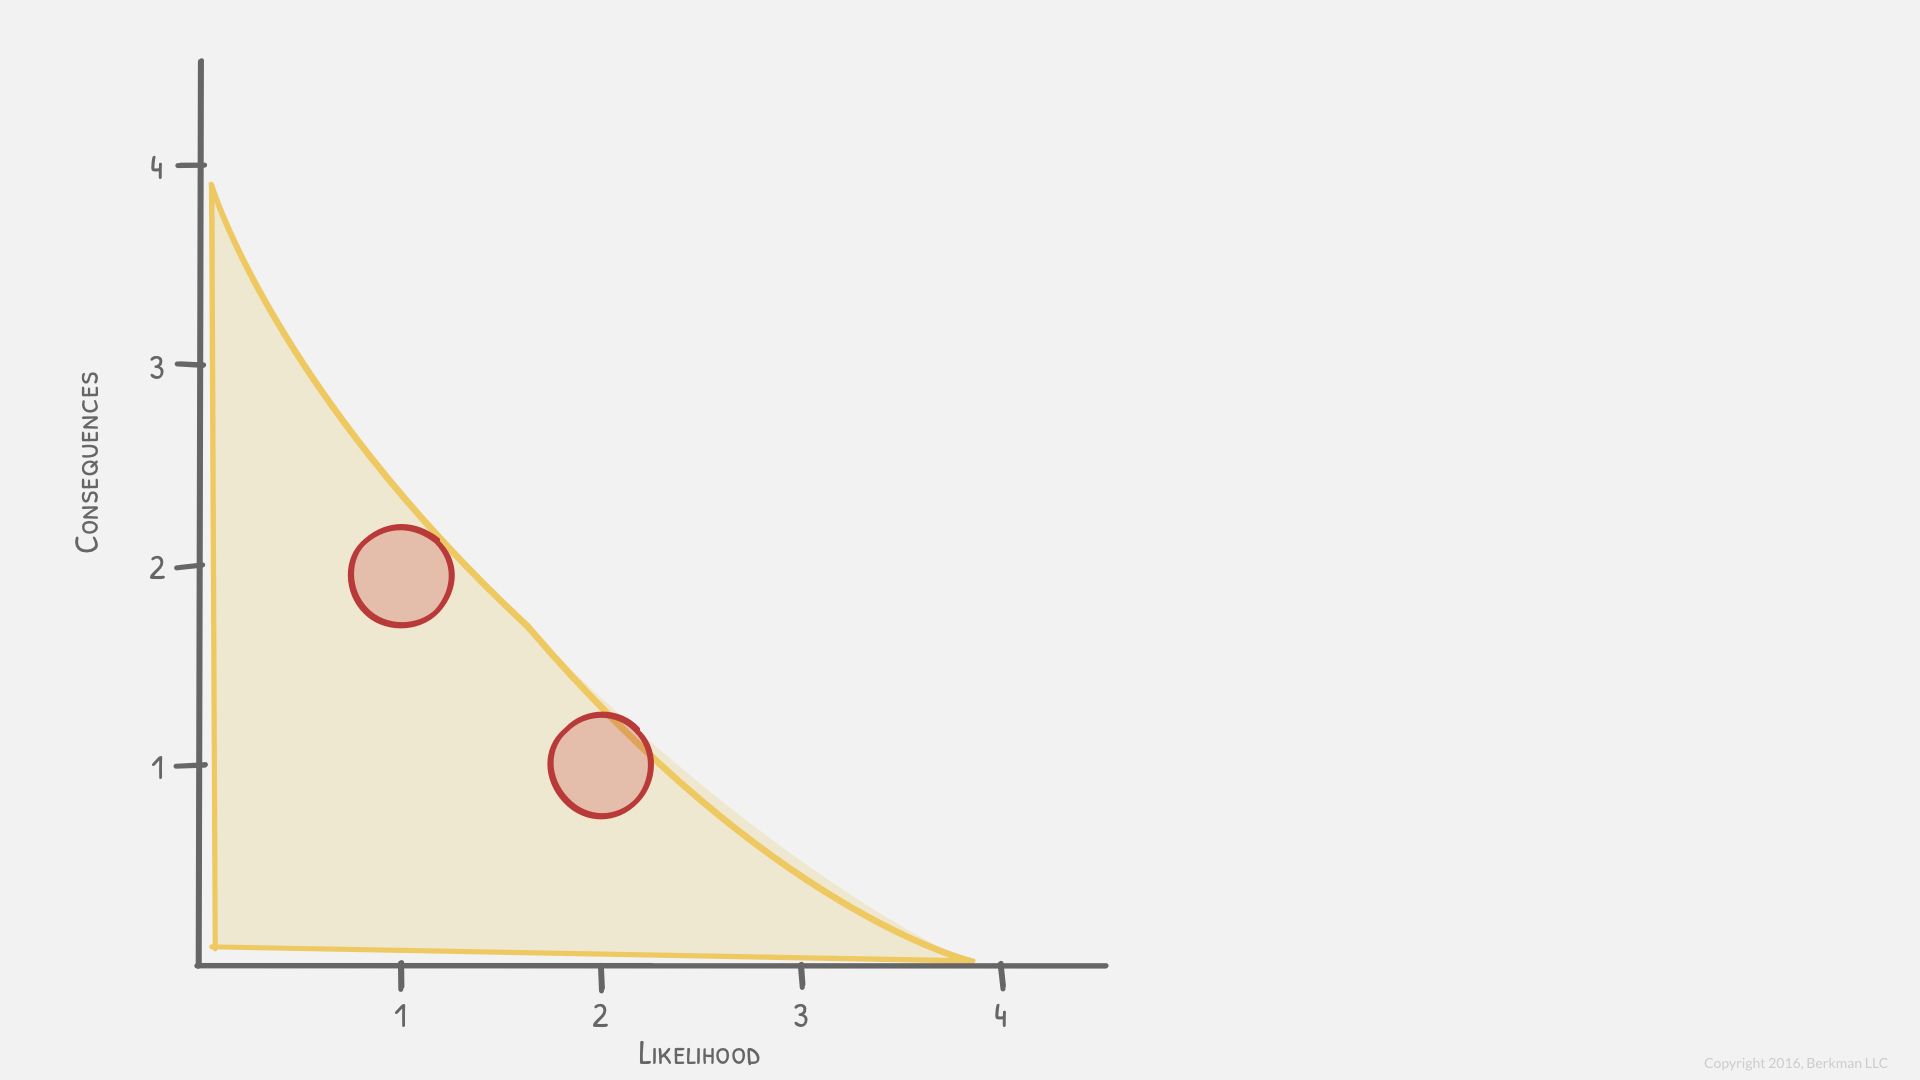
In this example, we have invested in risk mitigation to lower the consequences of the risk. Notice that we did nothing to change the likelihood. We lowered the consequences from 3 (Significant) to 2 (Material).
We will learn strategies to achieve this result later, but for now let’s assume that we acquire additional insurance proactively to cover some of the potential loss.
Also, notice that we did not eliminate the risk. There is still some likelihood that there will be a lawsuit that prevails. We simply reduce the financial damages from such an event.
Common sizing legal risks on a plot
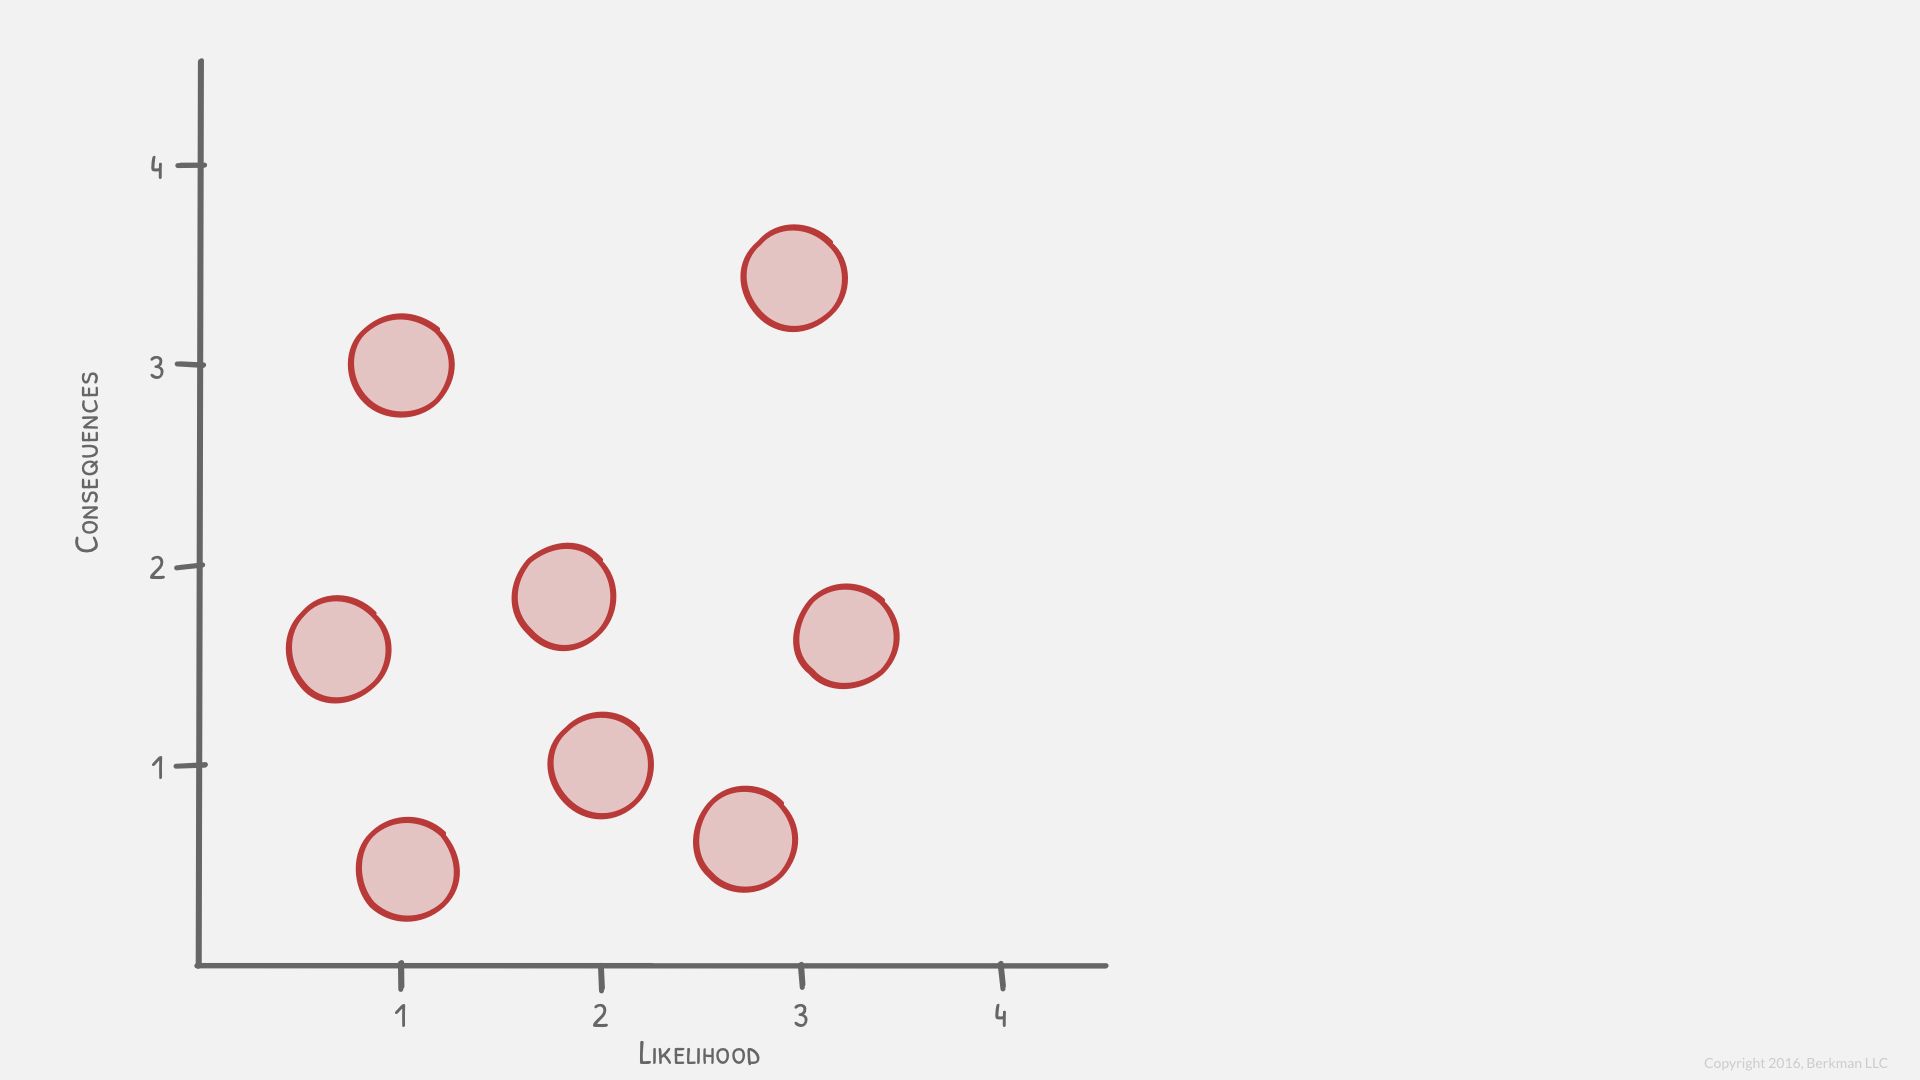
This chart shows eight risks. Each risk has a different likelihood and consequence rating. We have “common sized” these risks. Some are litigation, some are contract issues, and some are regulatory. They all fit on the chart.
Risk tolerance and risk criteria in context
Now let’s see how different organizations approach this same basket of risks. Keep in mind that the organizations can be different sizes, the ratings are relative.
Risk averse risk criteria
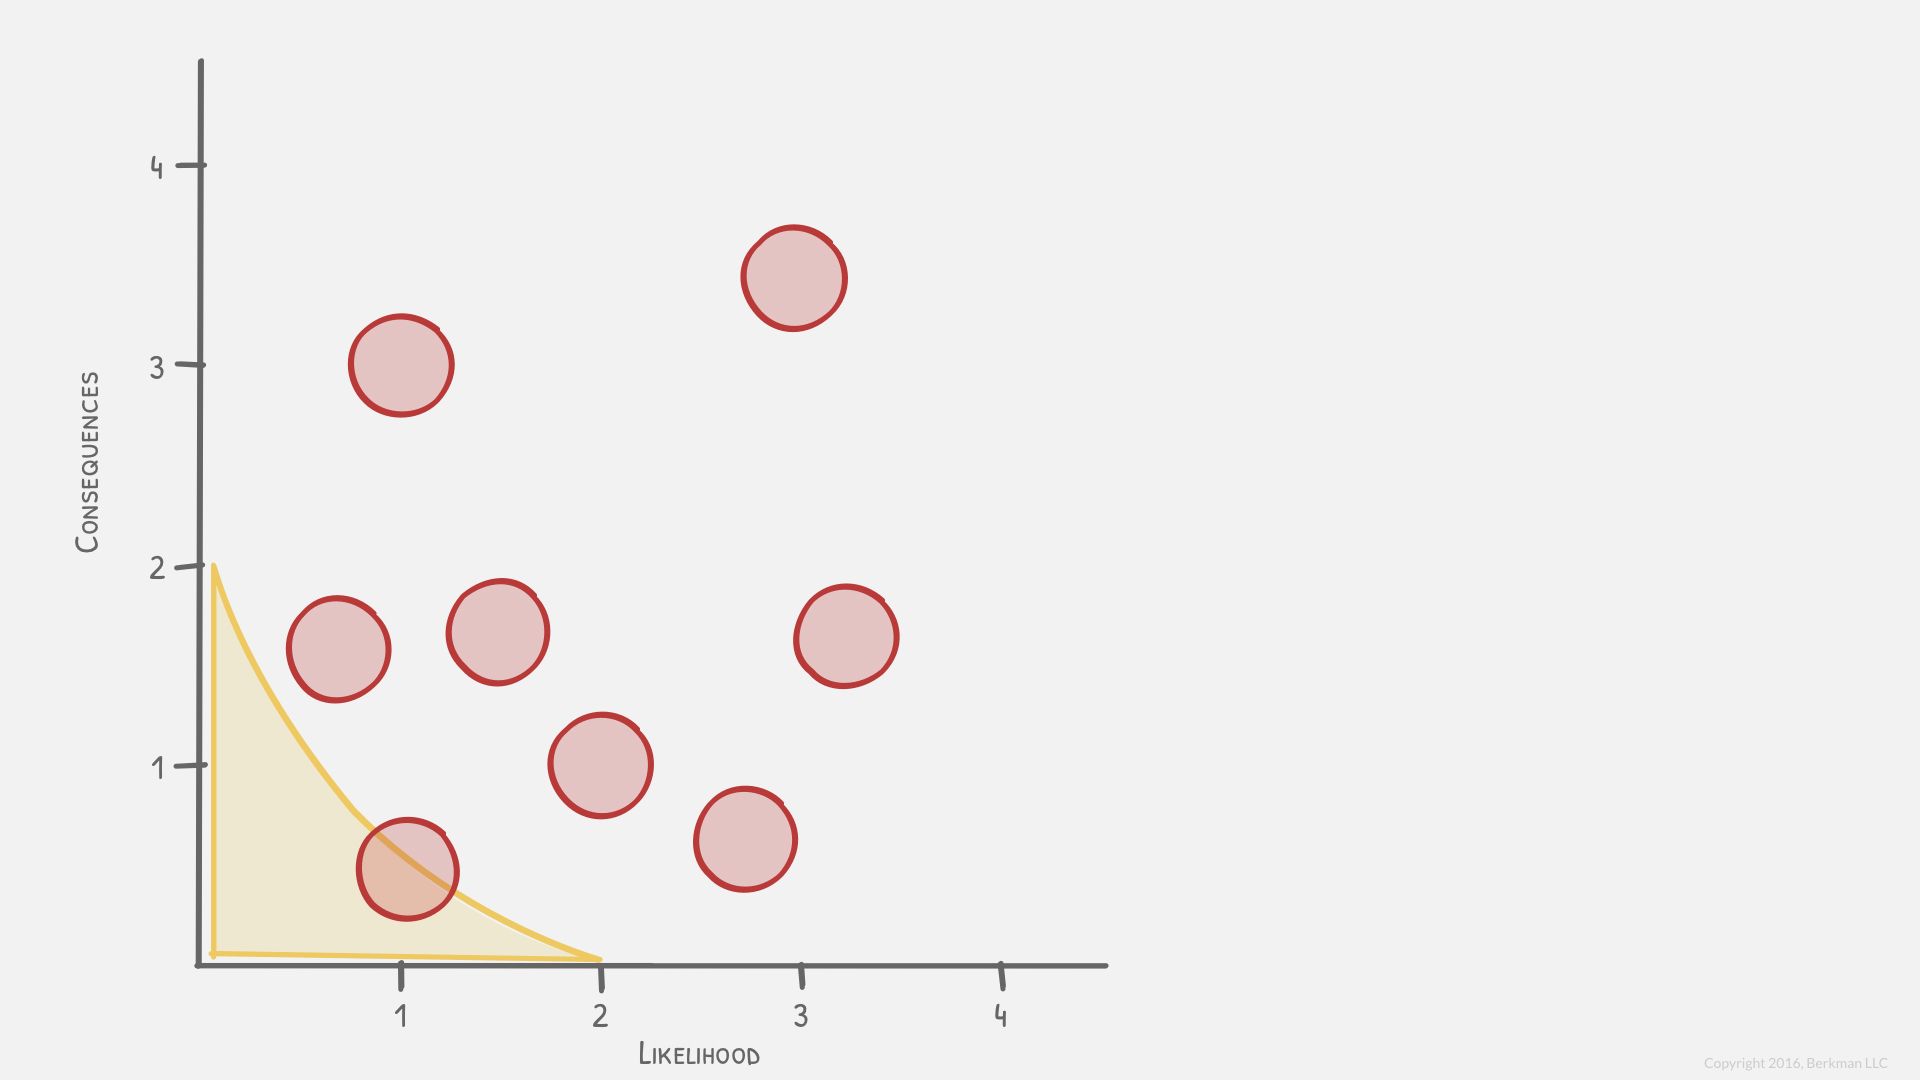
The first organization is strongly risk adverse. It will only accept risks whether either the likelihood or consequences is rated a 1 and the other can be a 2 at most. You can see that a risk which is rated a 2 on both consequences and likelihood would be outside the yellow triangle and therefore unacceptable.
Even the one risk down in that corner straddles the boundary. The legal risk management team will definitely debate whether or not to invest resources to reduce that risk.
Moderate risk tolerance risk criteria
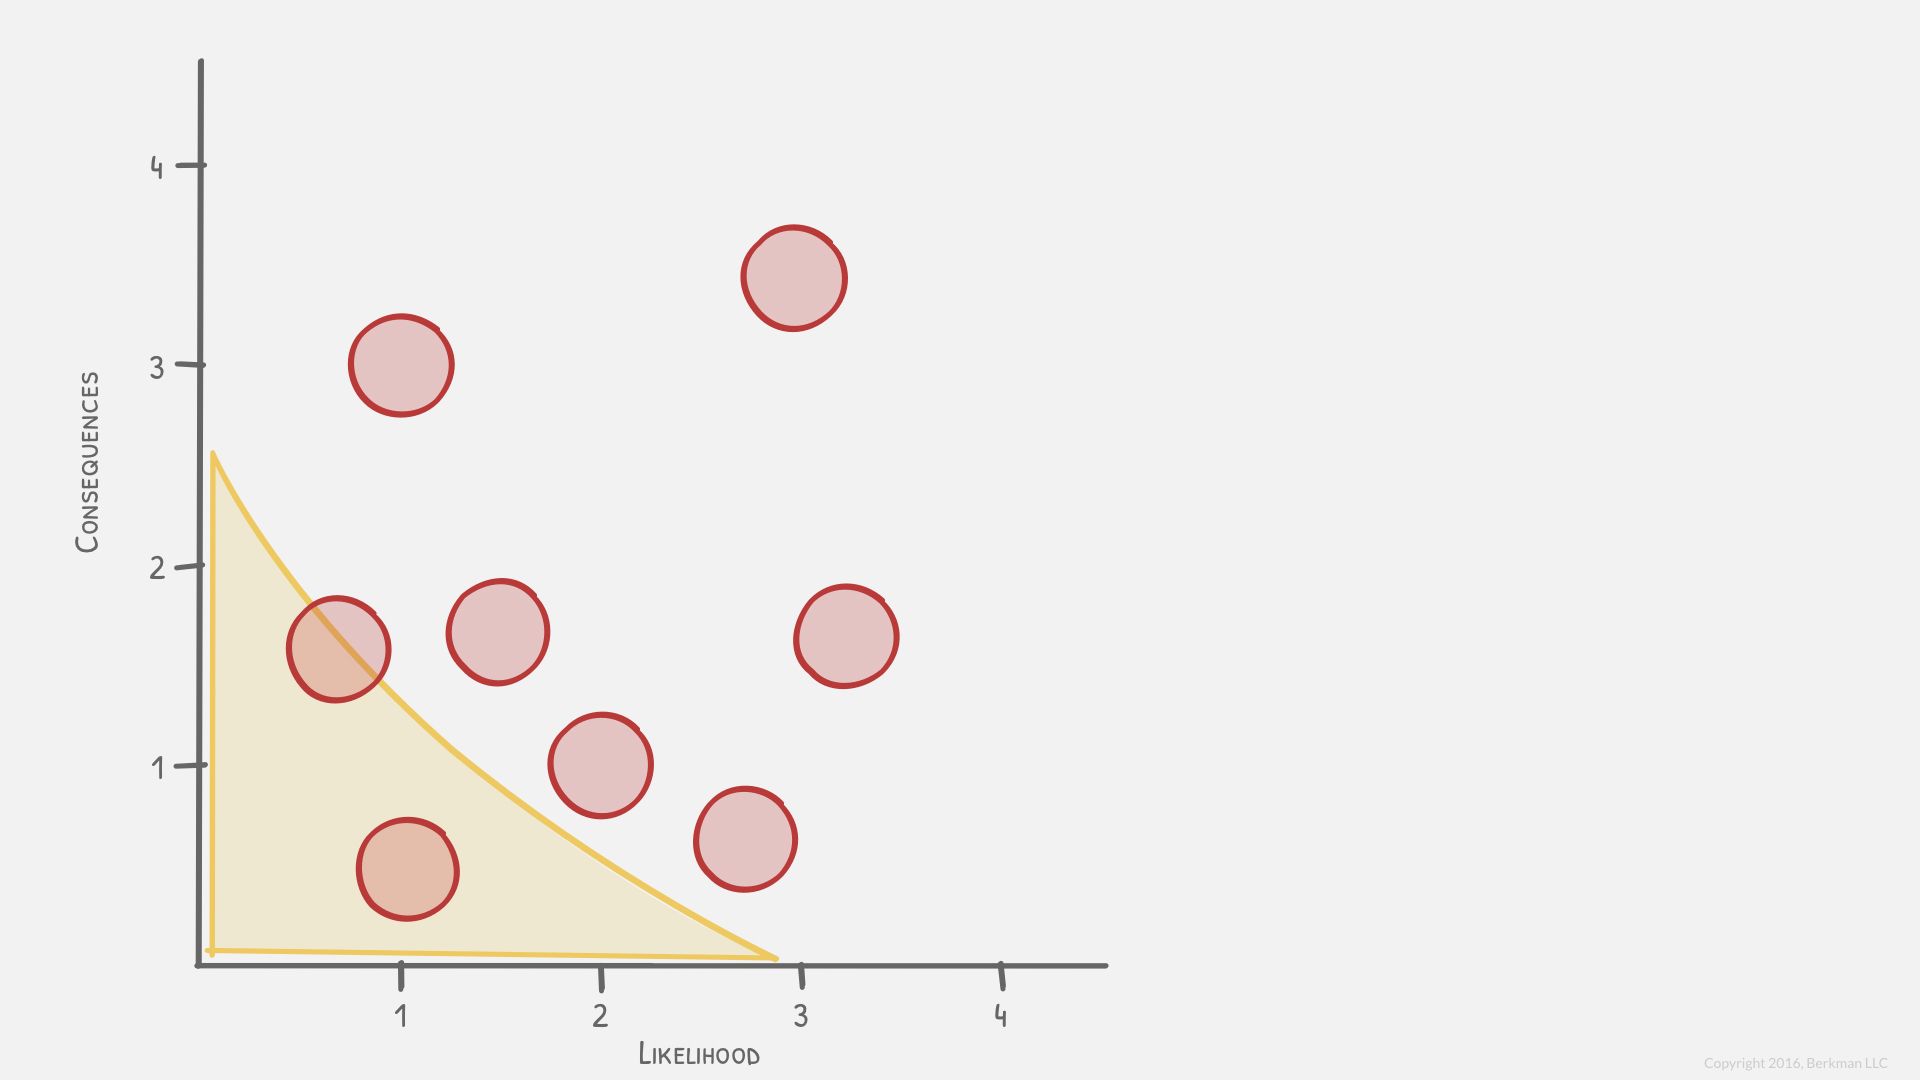
This organization has a bit more tolerance for risk. There is one risk that is clearly tolerable and one that is borderline. The tolerable risk will receive no risk mitigation.
Risk tolerant risk criteria
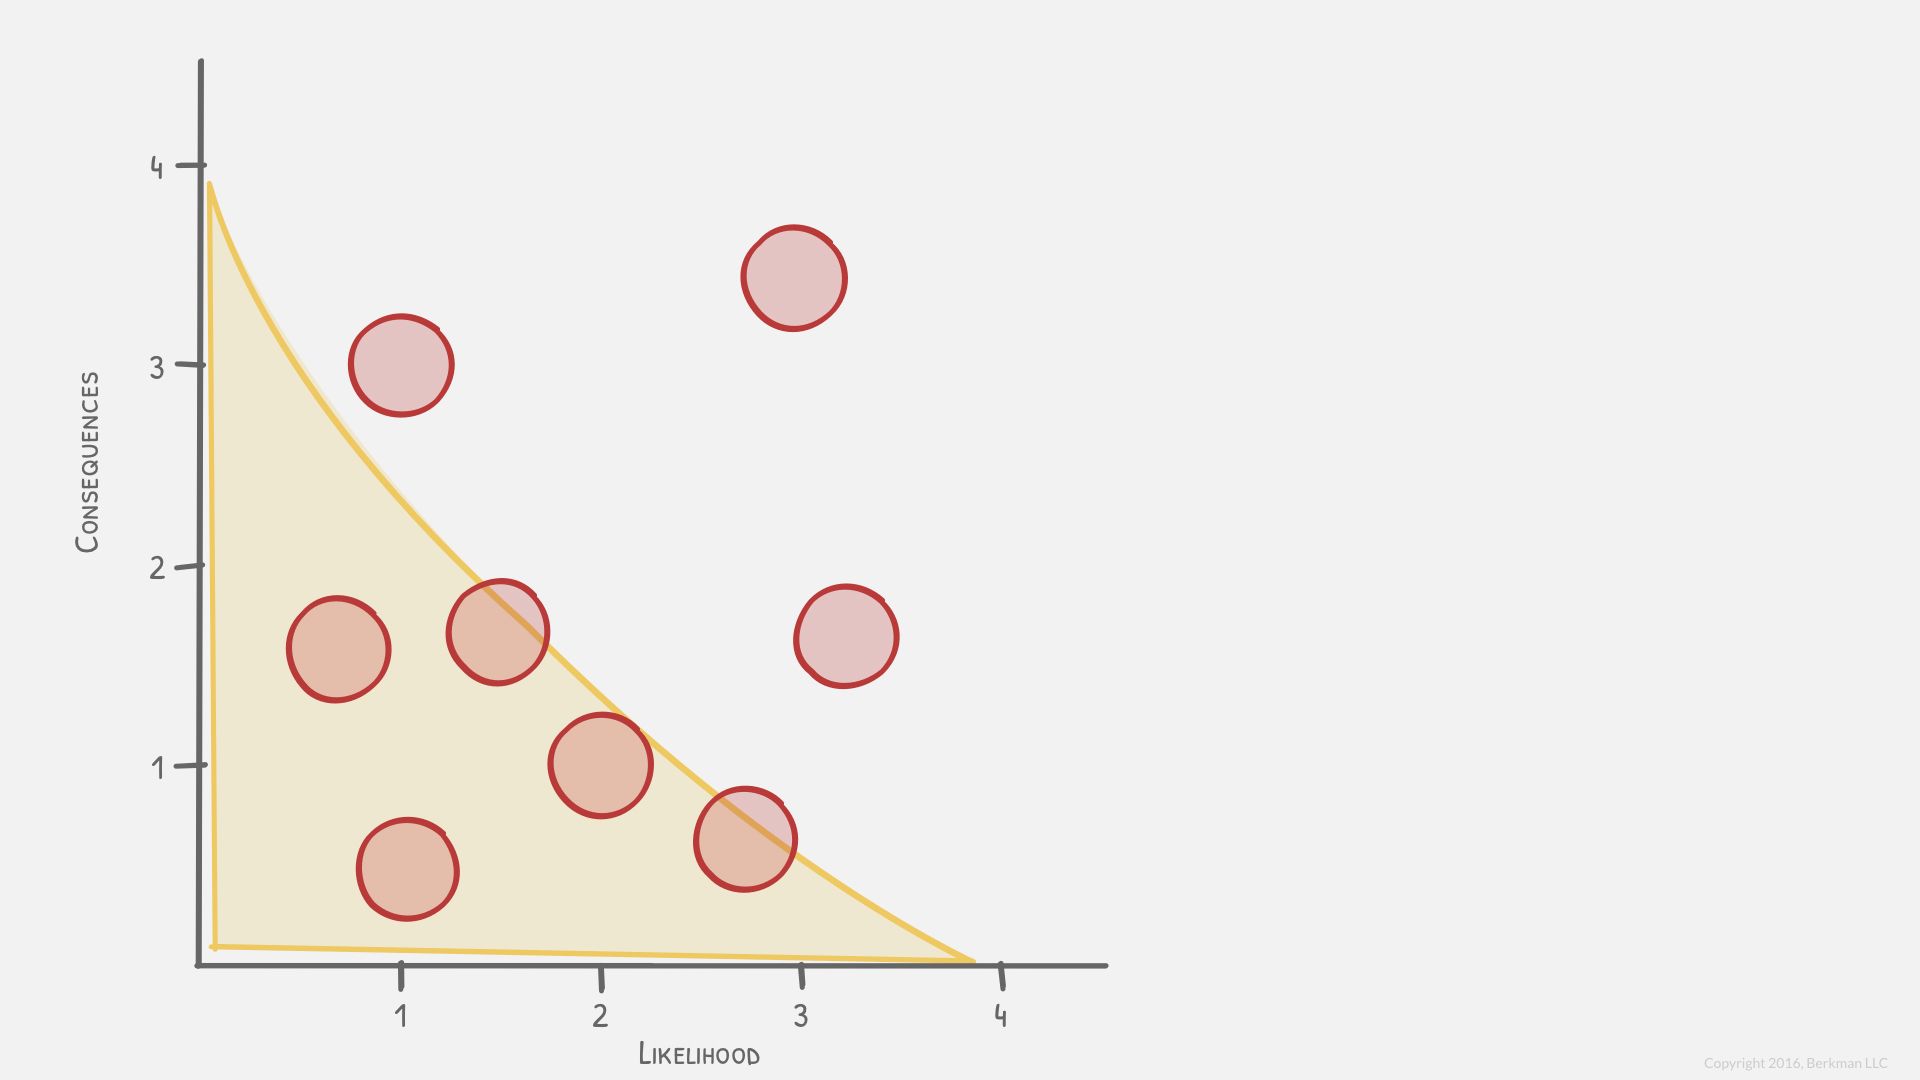
This organization is much more risk tolerant. Most of the risks are tolerable. Notice how this organization does not accept risks that approach 3 on either the likelihood or consequences scale.
Risk tolerances compared
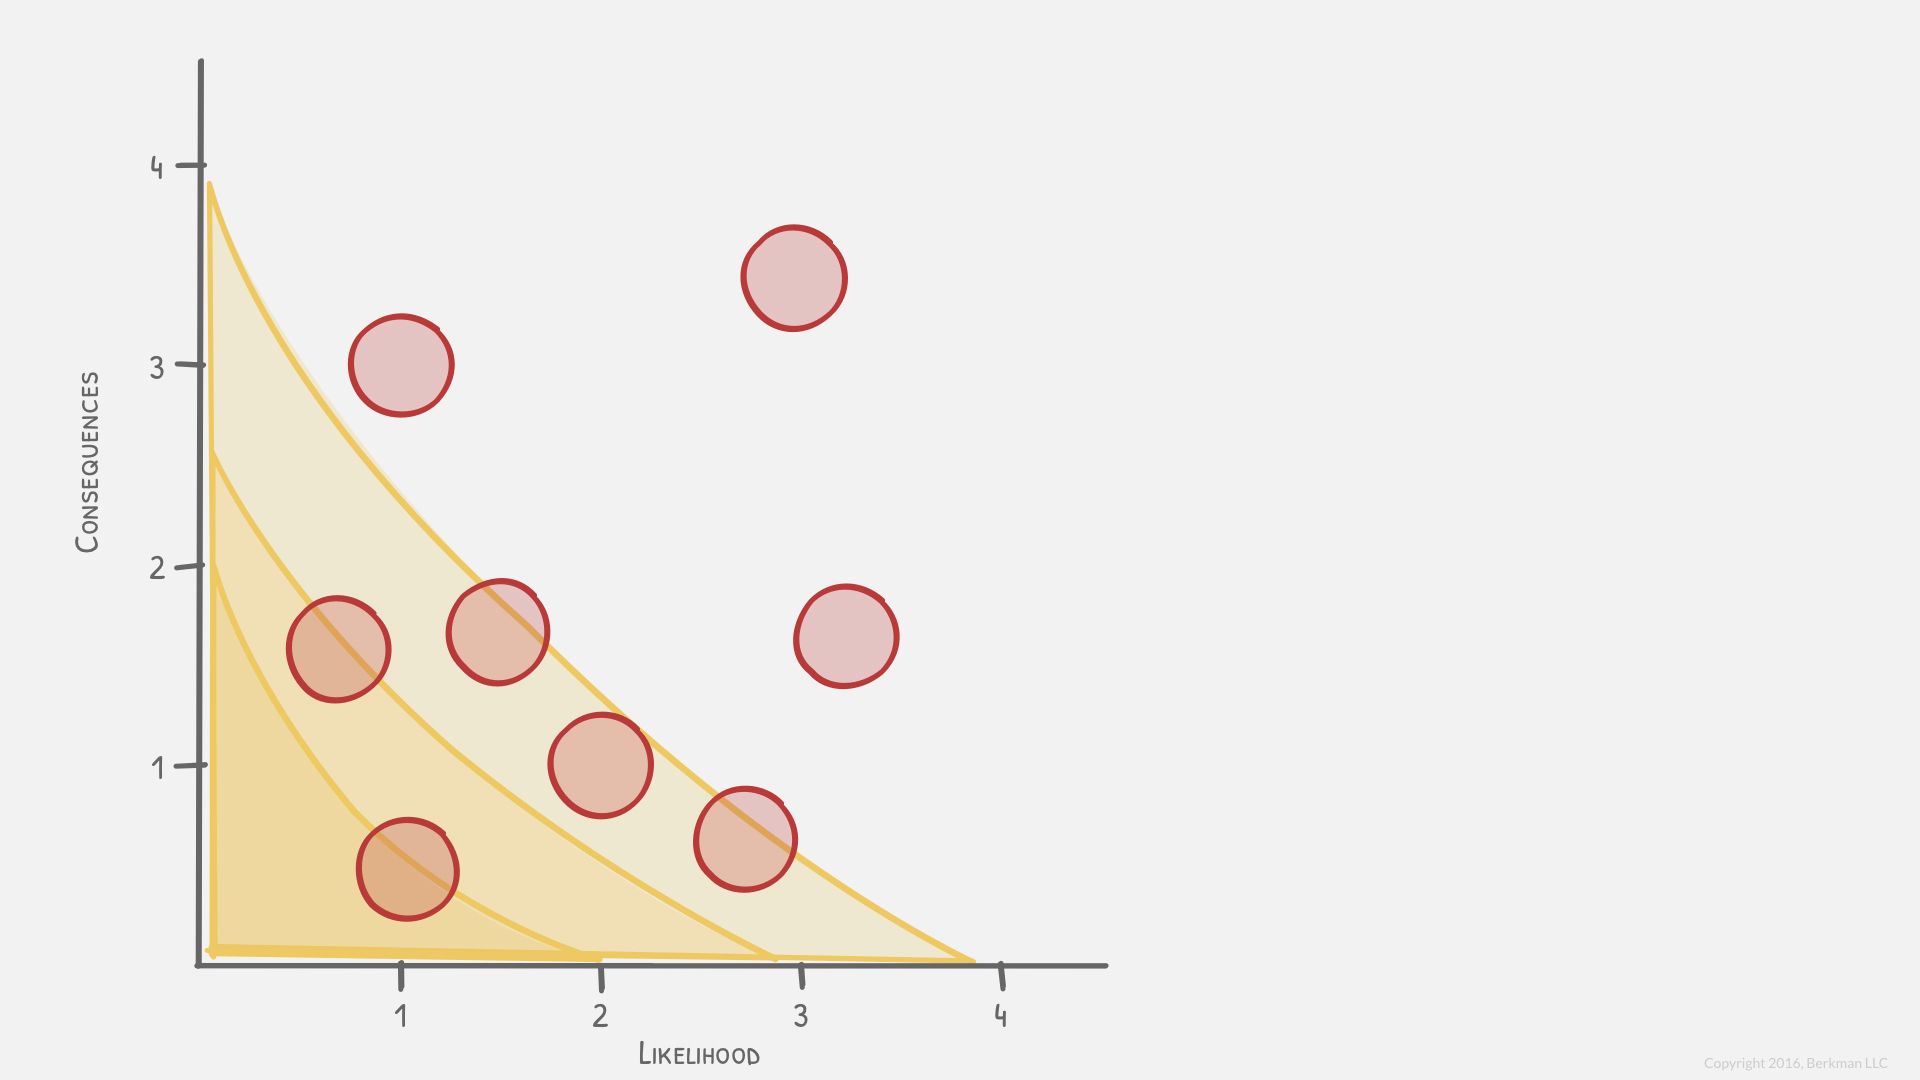
Here are all three organizations layered together. Of course, each organization agrees that the risk in the upper right is unacceptable.
Each organization draws this line differently. Consistent application of the risk tolerance policy is more important than chasing a universal approach.
